
Deploying interactive apps in CyVerse Discovery Environment
The current apps in the DE are non-interactive, meaning the user selects parameters and data for a particular analysis, and submits the job for execution on platforms (Condor, HPC via Agave). When the process completes, the user is notified and they can view their analysis results in a folder. Any desired changes in results requires the user to change analysis parameters and run the job again to full completion. But exploratory data analysis (EDA) requires user to click and interact with running applications (i.e Data Scientists need a Workbench). Availability of computational notebooks (Jupyter, Zepplin) and Rstudio’s Shiny allow users to readily share analysis in a reproducible manner and technologies like Javascript, WebGL, and others are making the web browser an extremely capable workbench
VICE (Visual Interactive Computing Environment) lets users interact with their data and do analyses in their favorite programming language in one place in an iterative way. Researchers can now explore their datasets interactively by easily changing parameters of selected analysis applications without having to download data from storage to an active workspace.
Here are the basic steps for deploying Docker images as interactive apps (VICE) in DE. For this tutorial I am going to show an example of Keras wine classifier
First log-in CyVerse DE
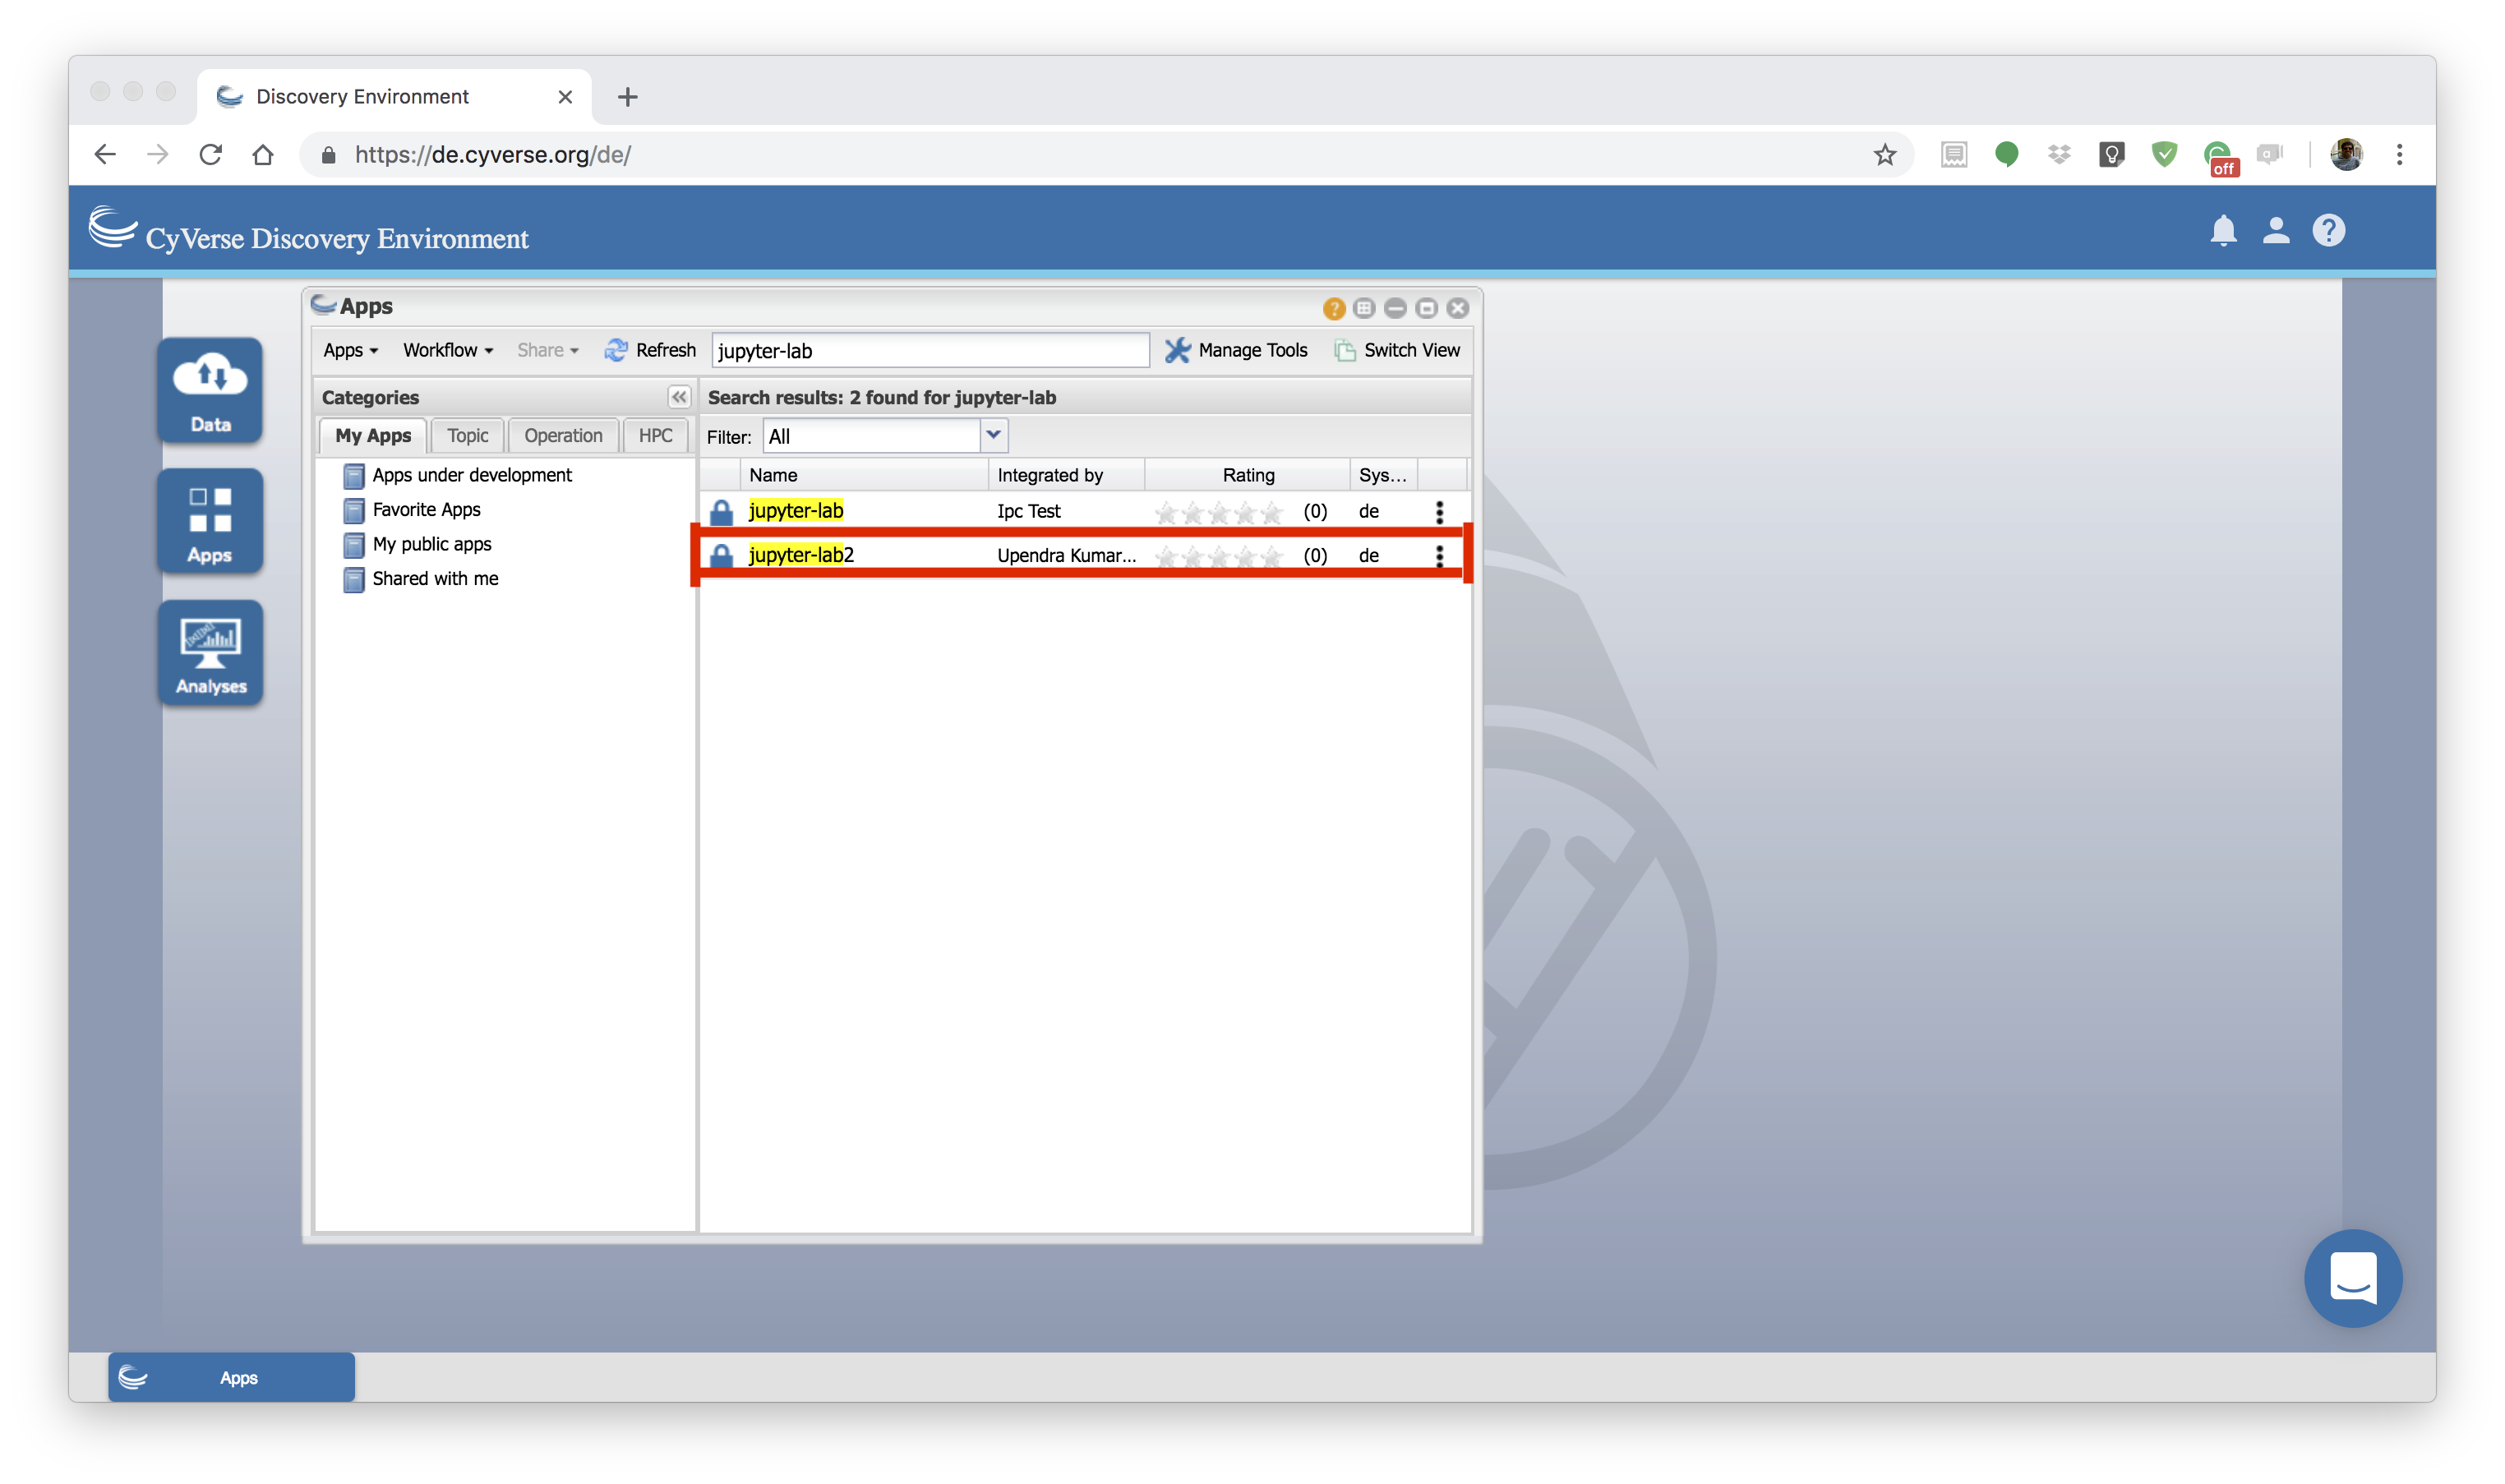
1. Search JupyterLab App
After you login to DE, open the Apps window and search the JupyterLab with key word JupyterLab.
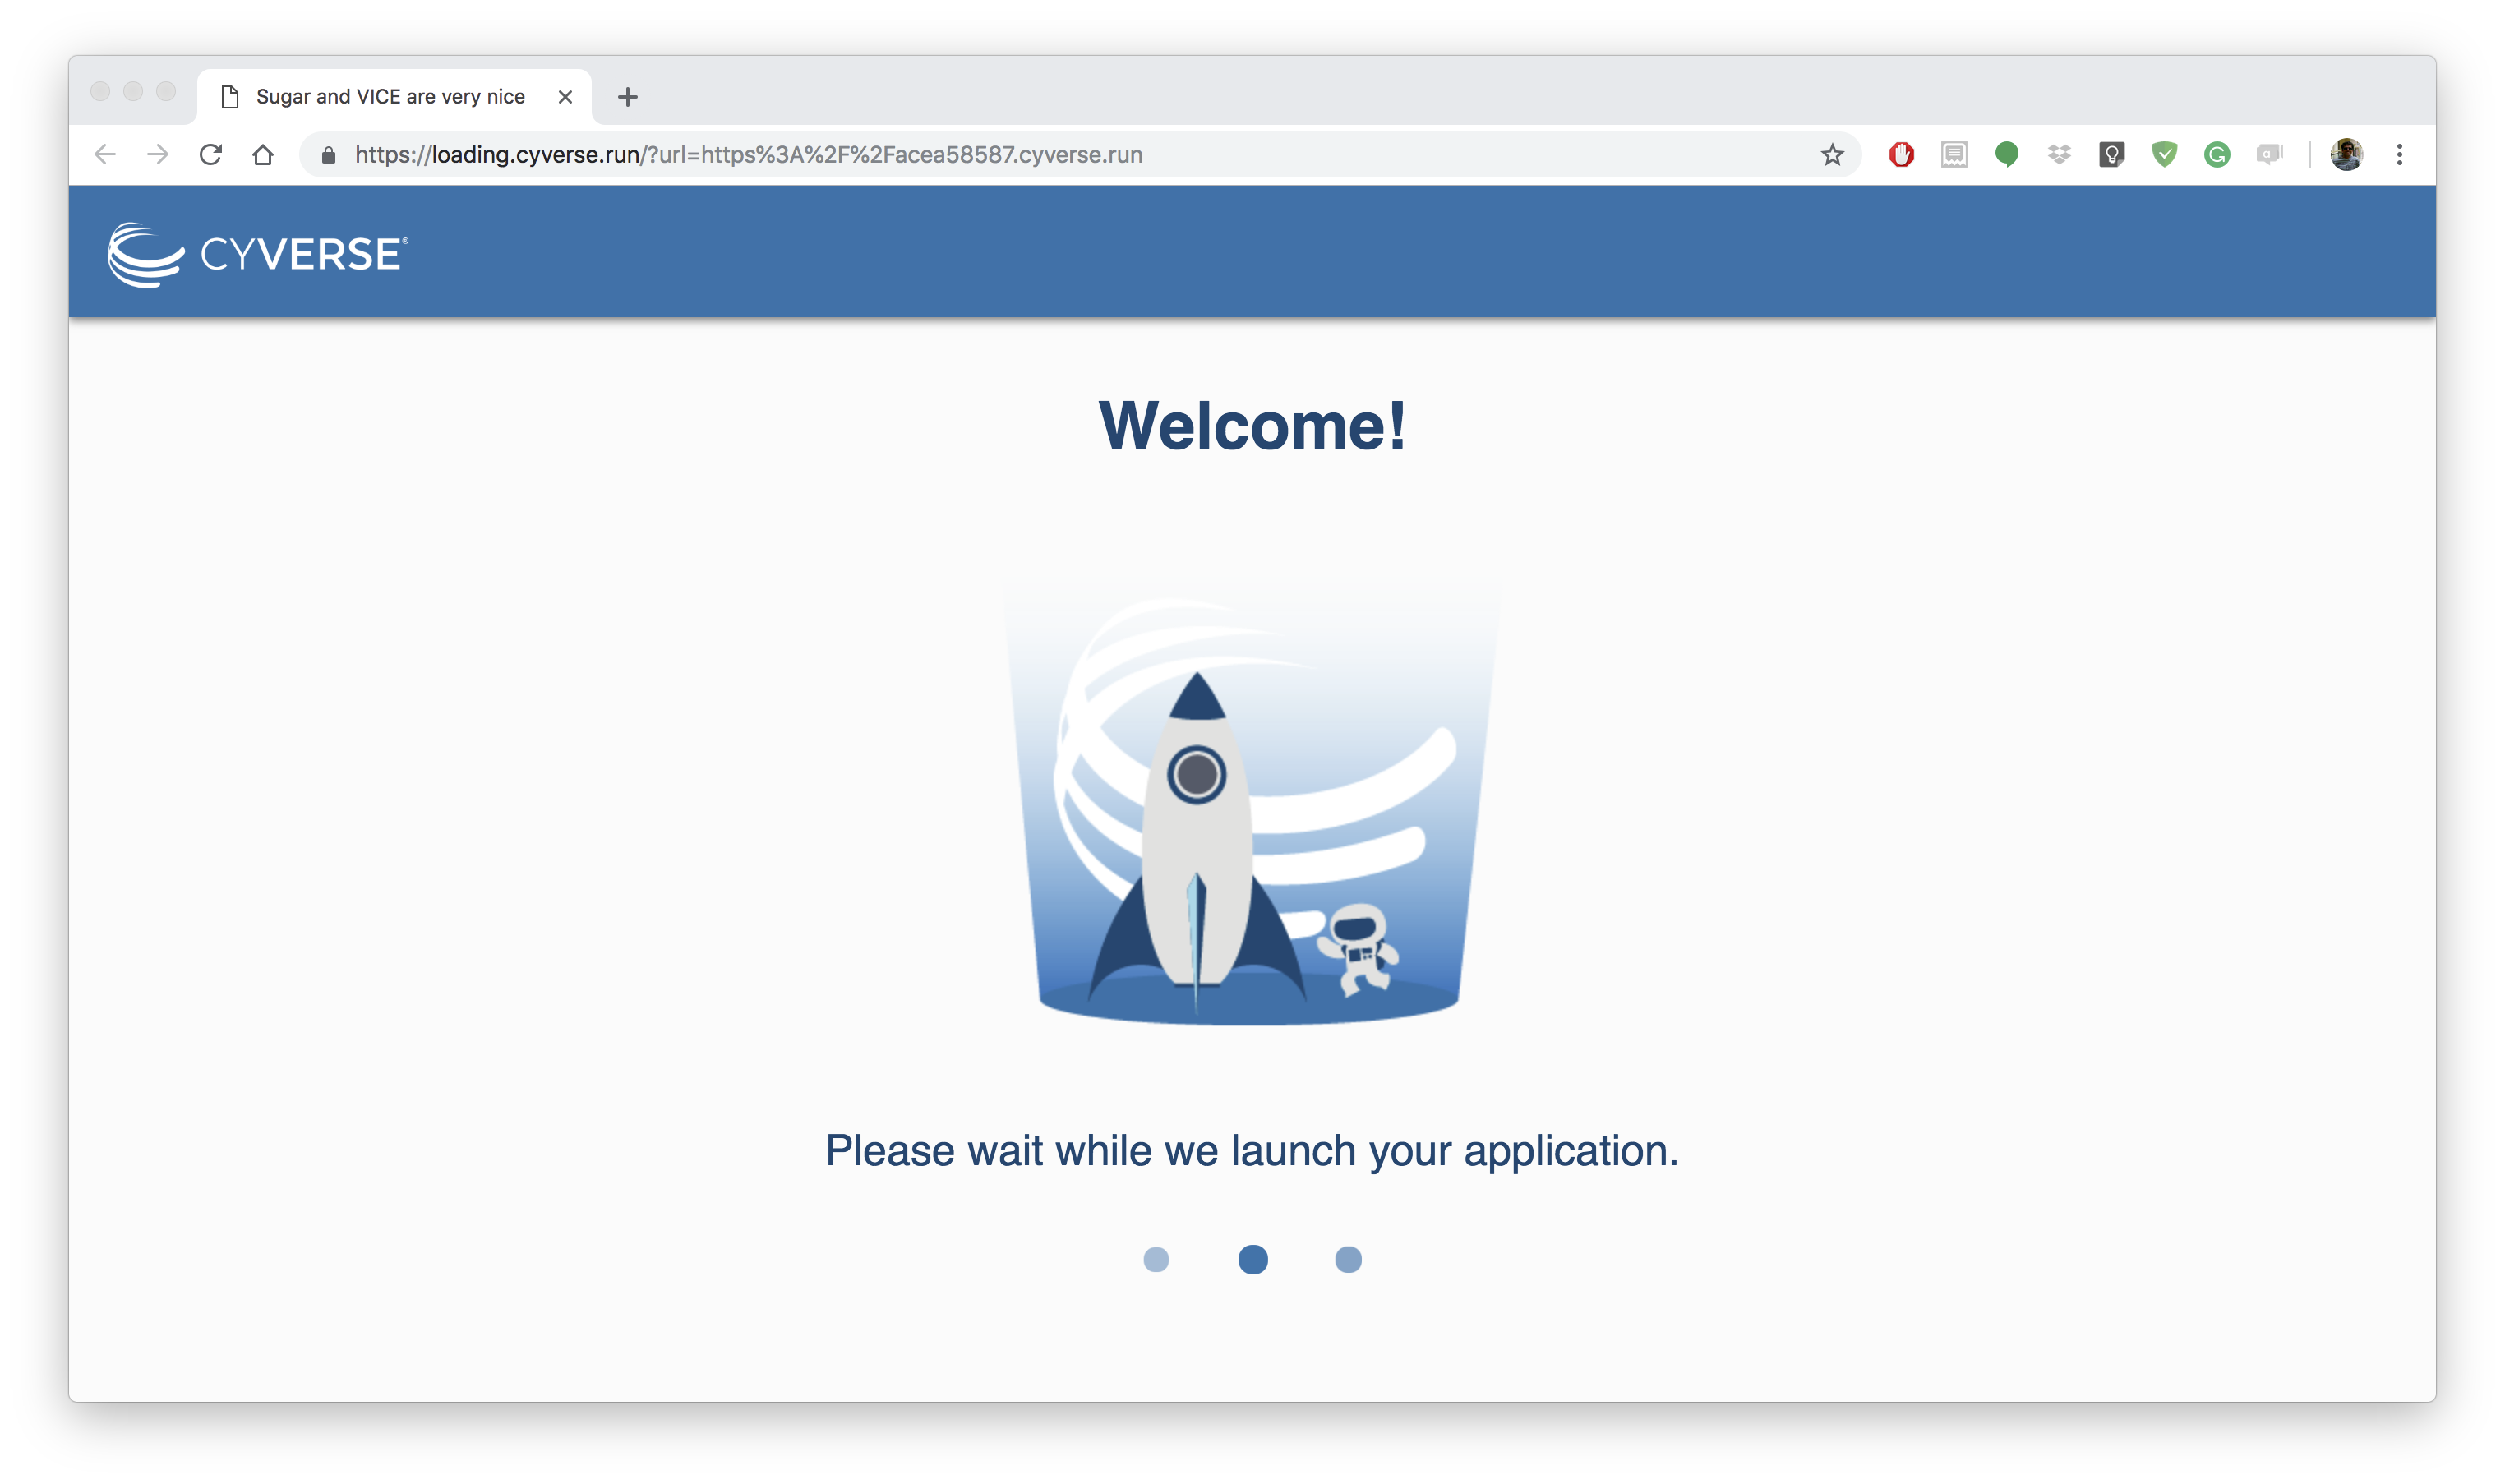
2. Launch analysis
Launch the JupyterLab app by clicking launch analysis. Before you launch, you can either drag and drop or browse the files that you want to use with Jupyter-lab. There is currently no restriction of how many files and size of the files that can be launched along with JupyterLab app.


Note
The first two steps of launching apps are same as with other DE apps.
3. Navigate to JupyterLab url
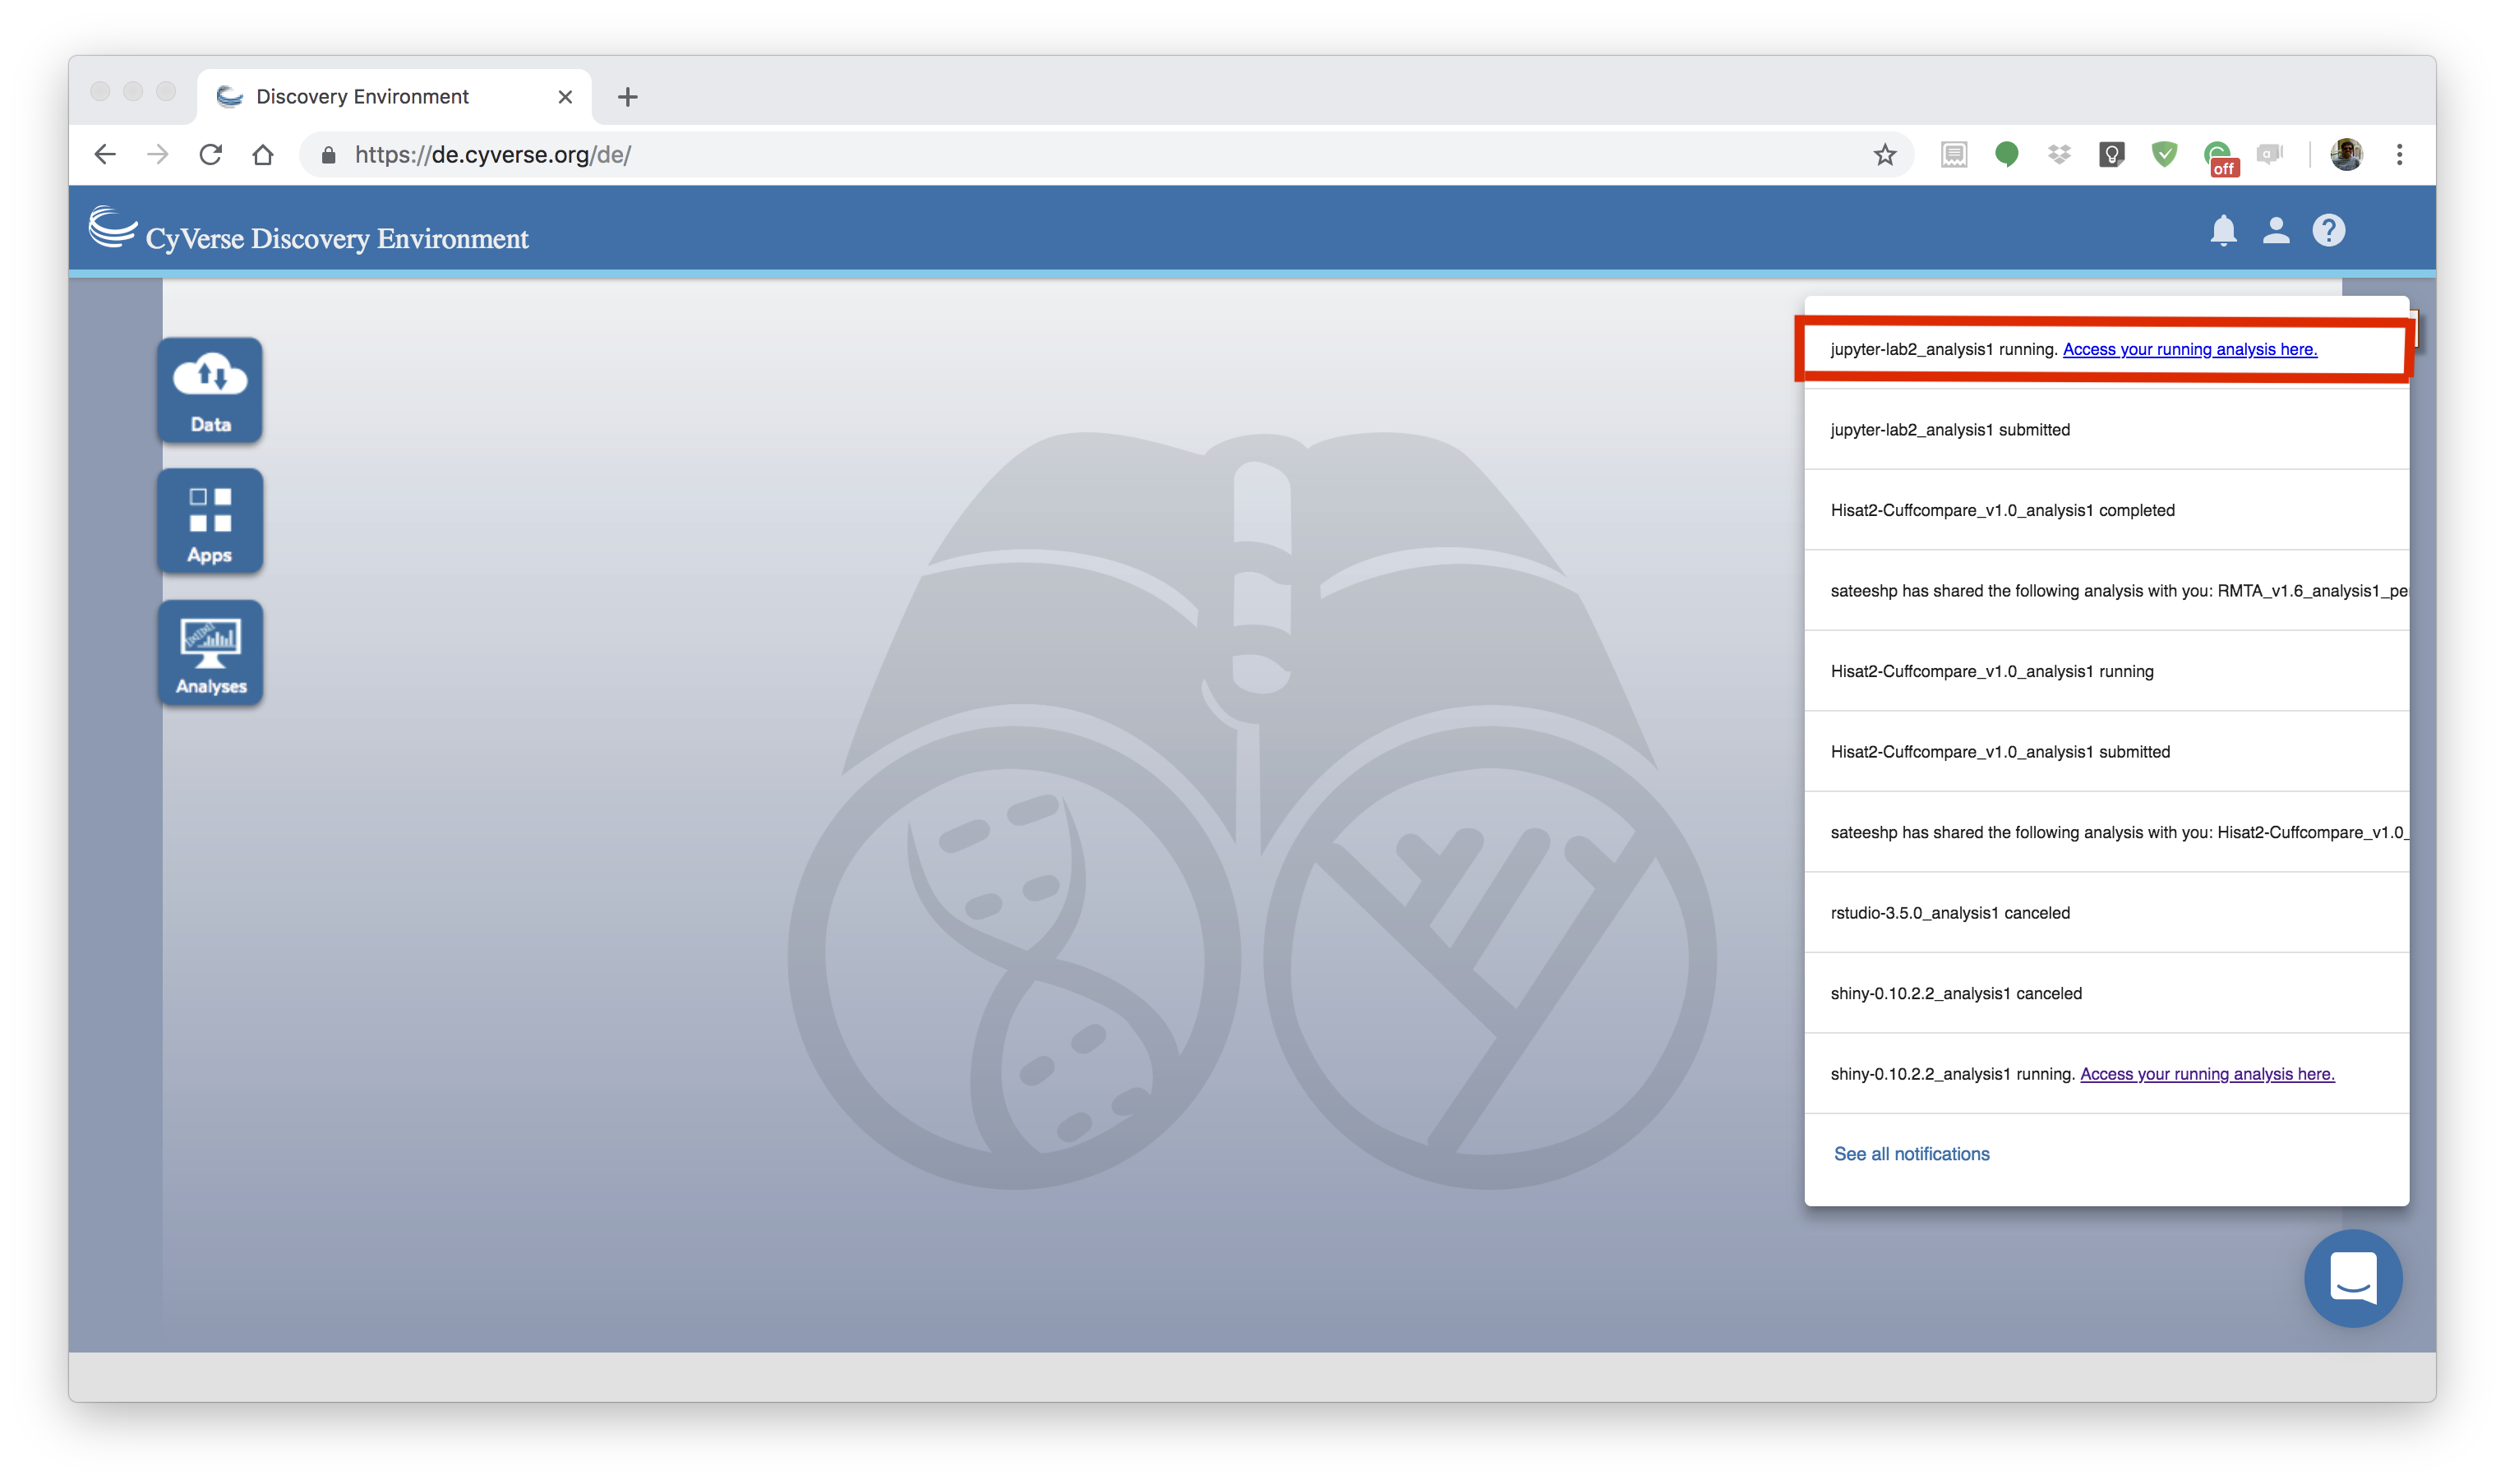
Unlike regular DE apps once the analysis starts running you will get url. Clicking on the “Access your running Analysis here” url will redirect you to a page with a welcome message
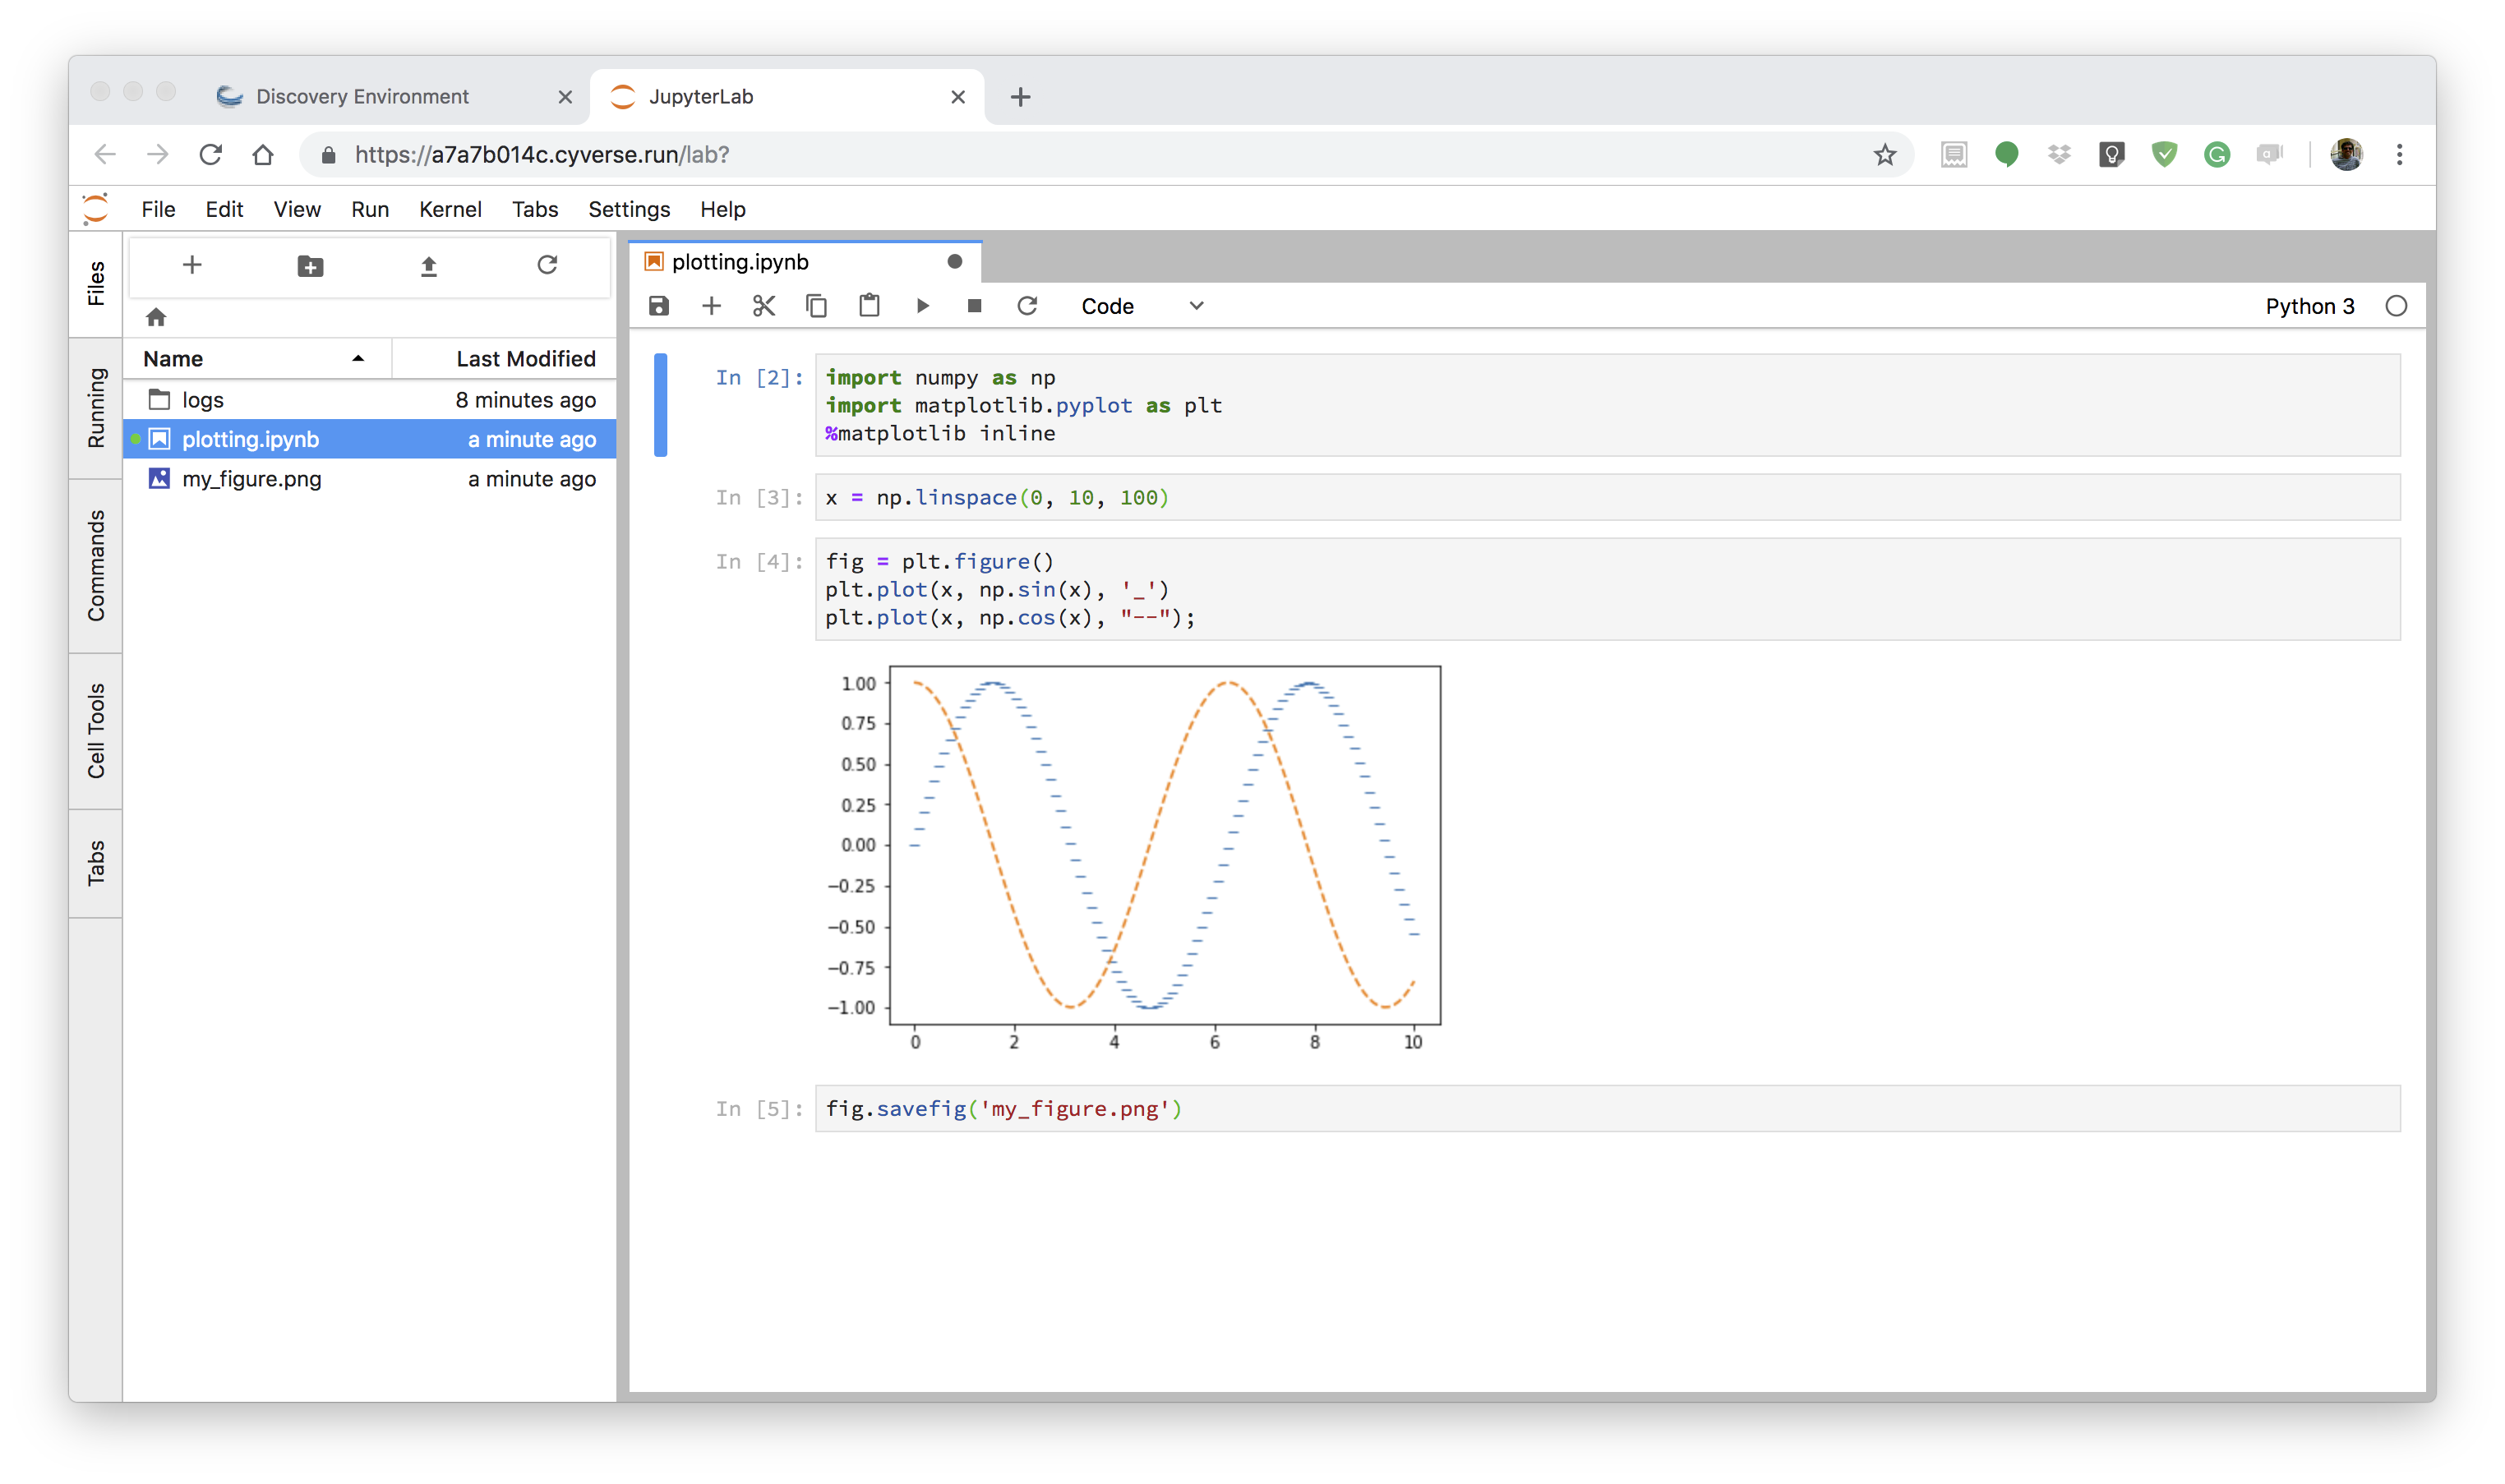
After it finished loading your app, the JupyterLab Interface automatically appears in your browser.
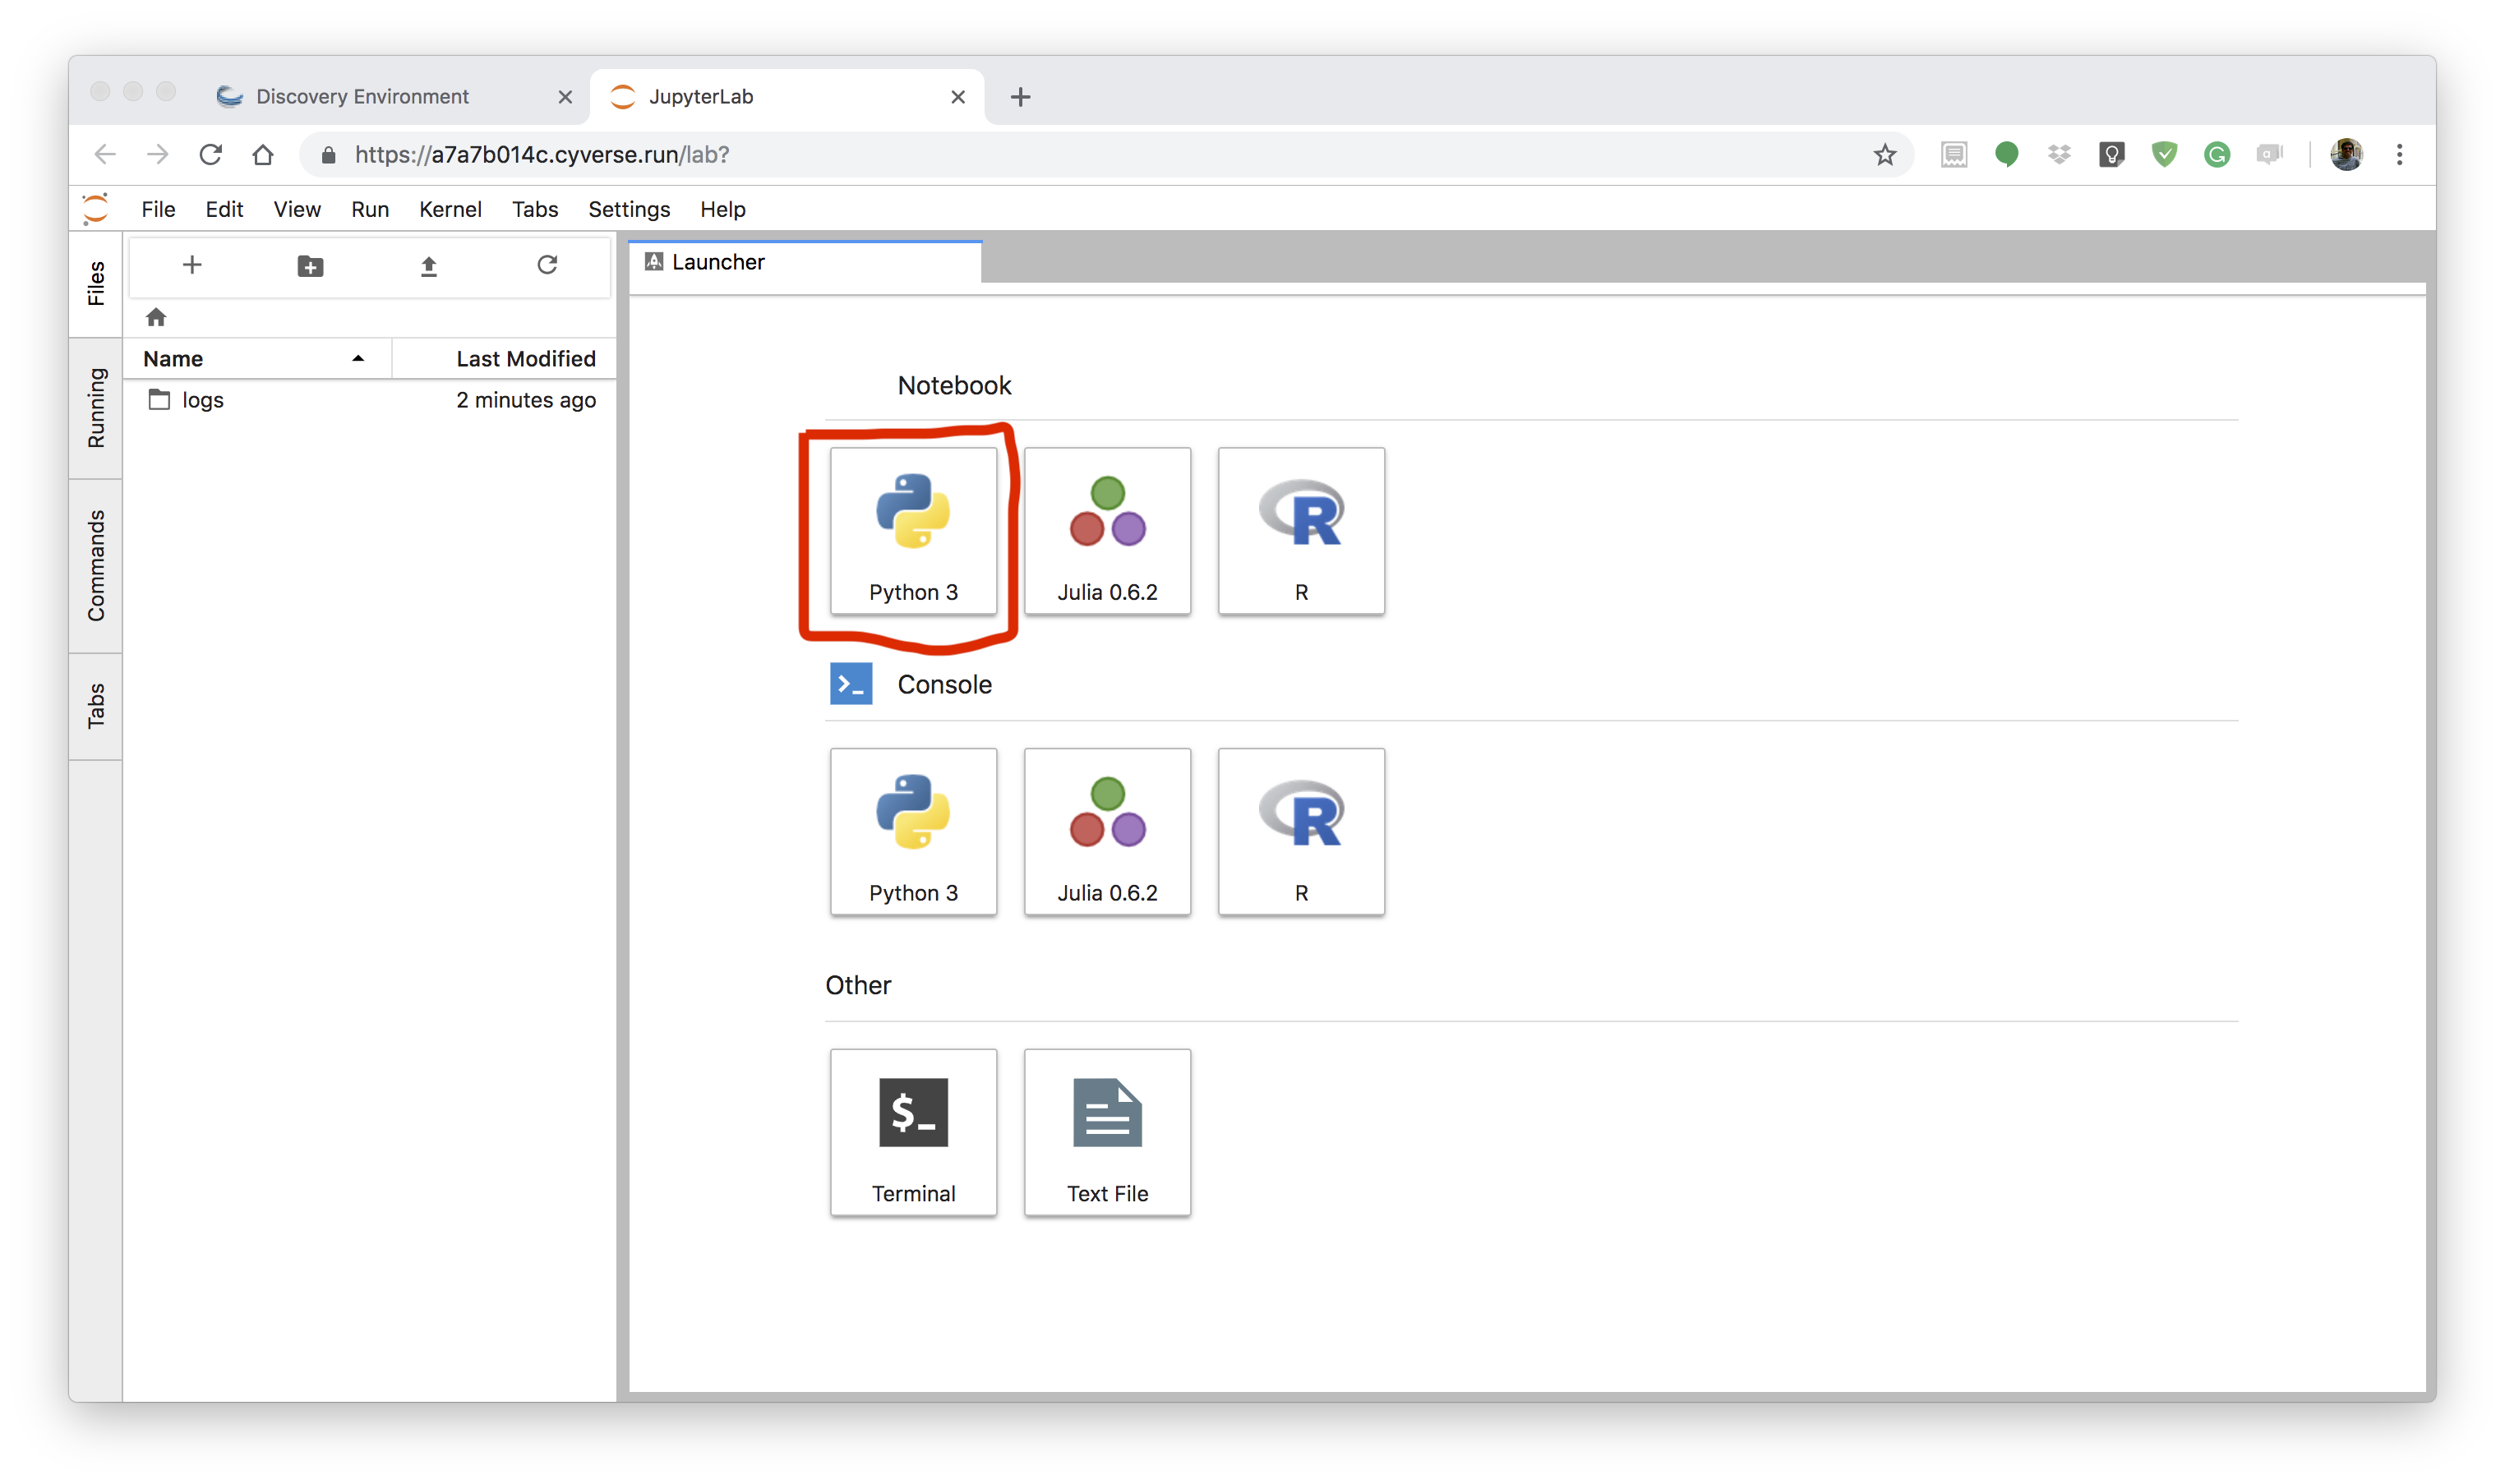
The JupyterLab Interface: JupyterLab provides flexible building blocks for interactive, exploratory computing. While JupyterLab has many features found in traditional integrated development environments (IDEs), it remains focused on interactive, exploratory computing. The JupyterLab interface consists of a main work area containing tabs of documents and activities, a collapsible left sidebar, and a menu bar. The left sidebar contains a file browser, the list of running kernels and terminals, the command palette, the notebook cell tools inspector, and the tabs list.
More information about the JupyterLab can be found here
4. Create Jupyter notebook
Jupyter notebooks are documents that combine live runnable code with narrative text (Markdown), equations (LaTeX), images, interactive visualizations and other rich output. Jupyter notebooks (.ipynb files) are fully supported in JupyterLab
If you want to create a notebook, you can do so by clicking the + button in the file browser and then selecting a kernel in the new Launcher tab. Currently there are 3 different notebooks available - Python3, Julia and R. Click on Python 3 under Notebook section in the JupyterLab Interface, which will open a new Jupyter Notebook. A new file is created with a default name. Rename a file by right-clicking on its name in the file browser and selecting “Rename” from the context menu.
To know more about notebooks in JupyterLab click here
Tip
To open the classic Notebook from JupyterLab, select “Launch Classic Notebook” from the JupyterLab Help menu.
Note
There are plenty other cool stuff that you can do in JupyterLab such as using consoles, using terminal and using text editor
5. Write your code
Once you open a new notebook, you can start writing your code, put markdown text, generate plots, save plots etc.
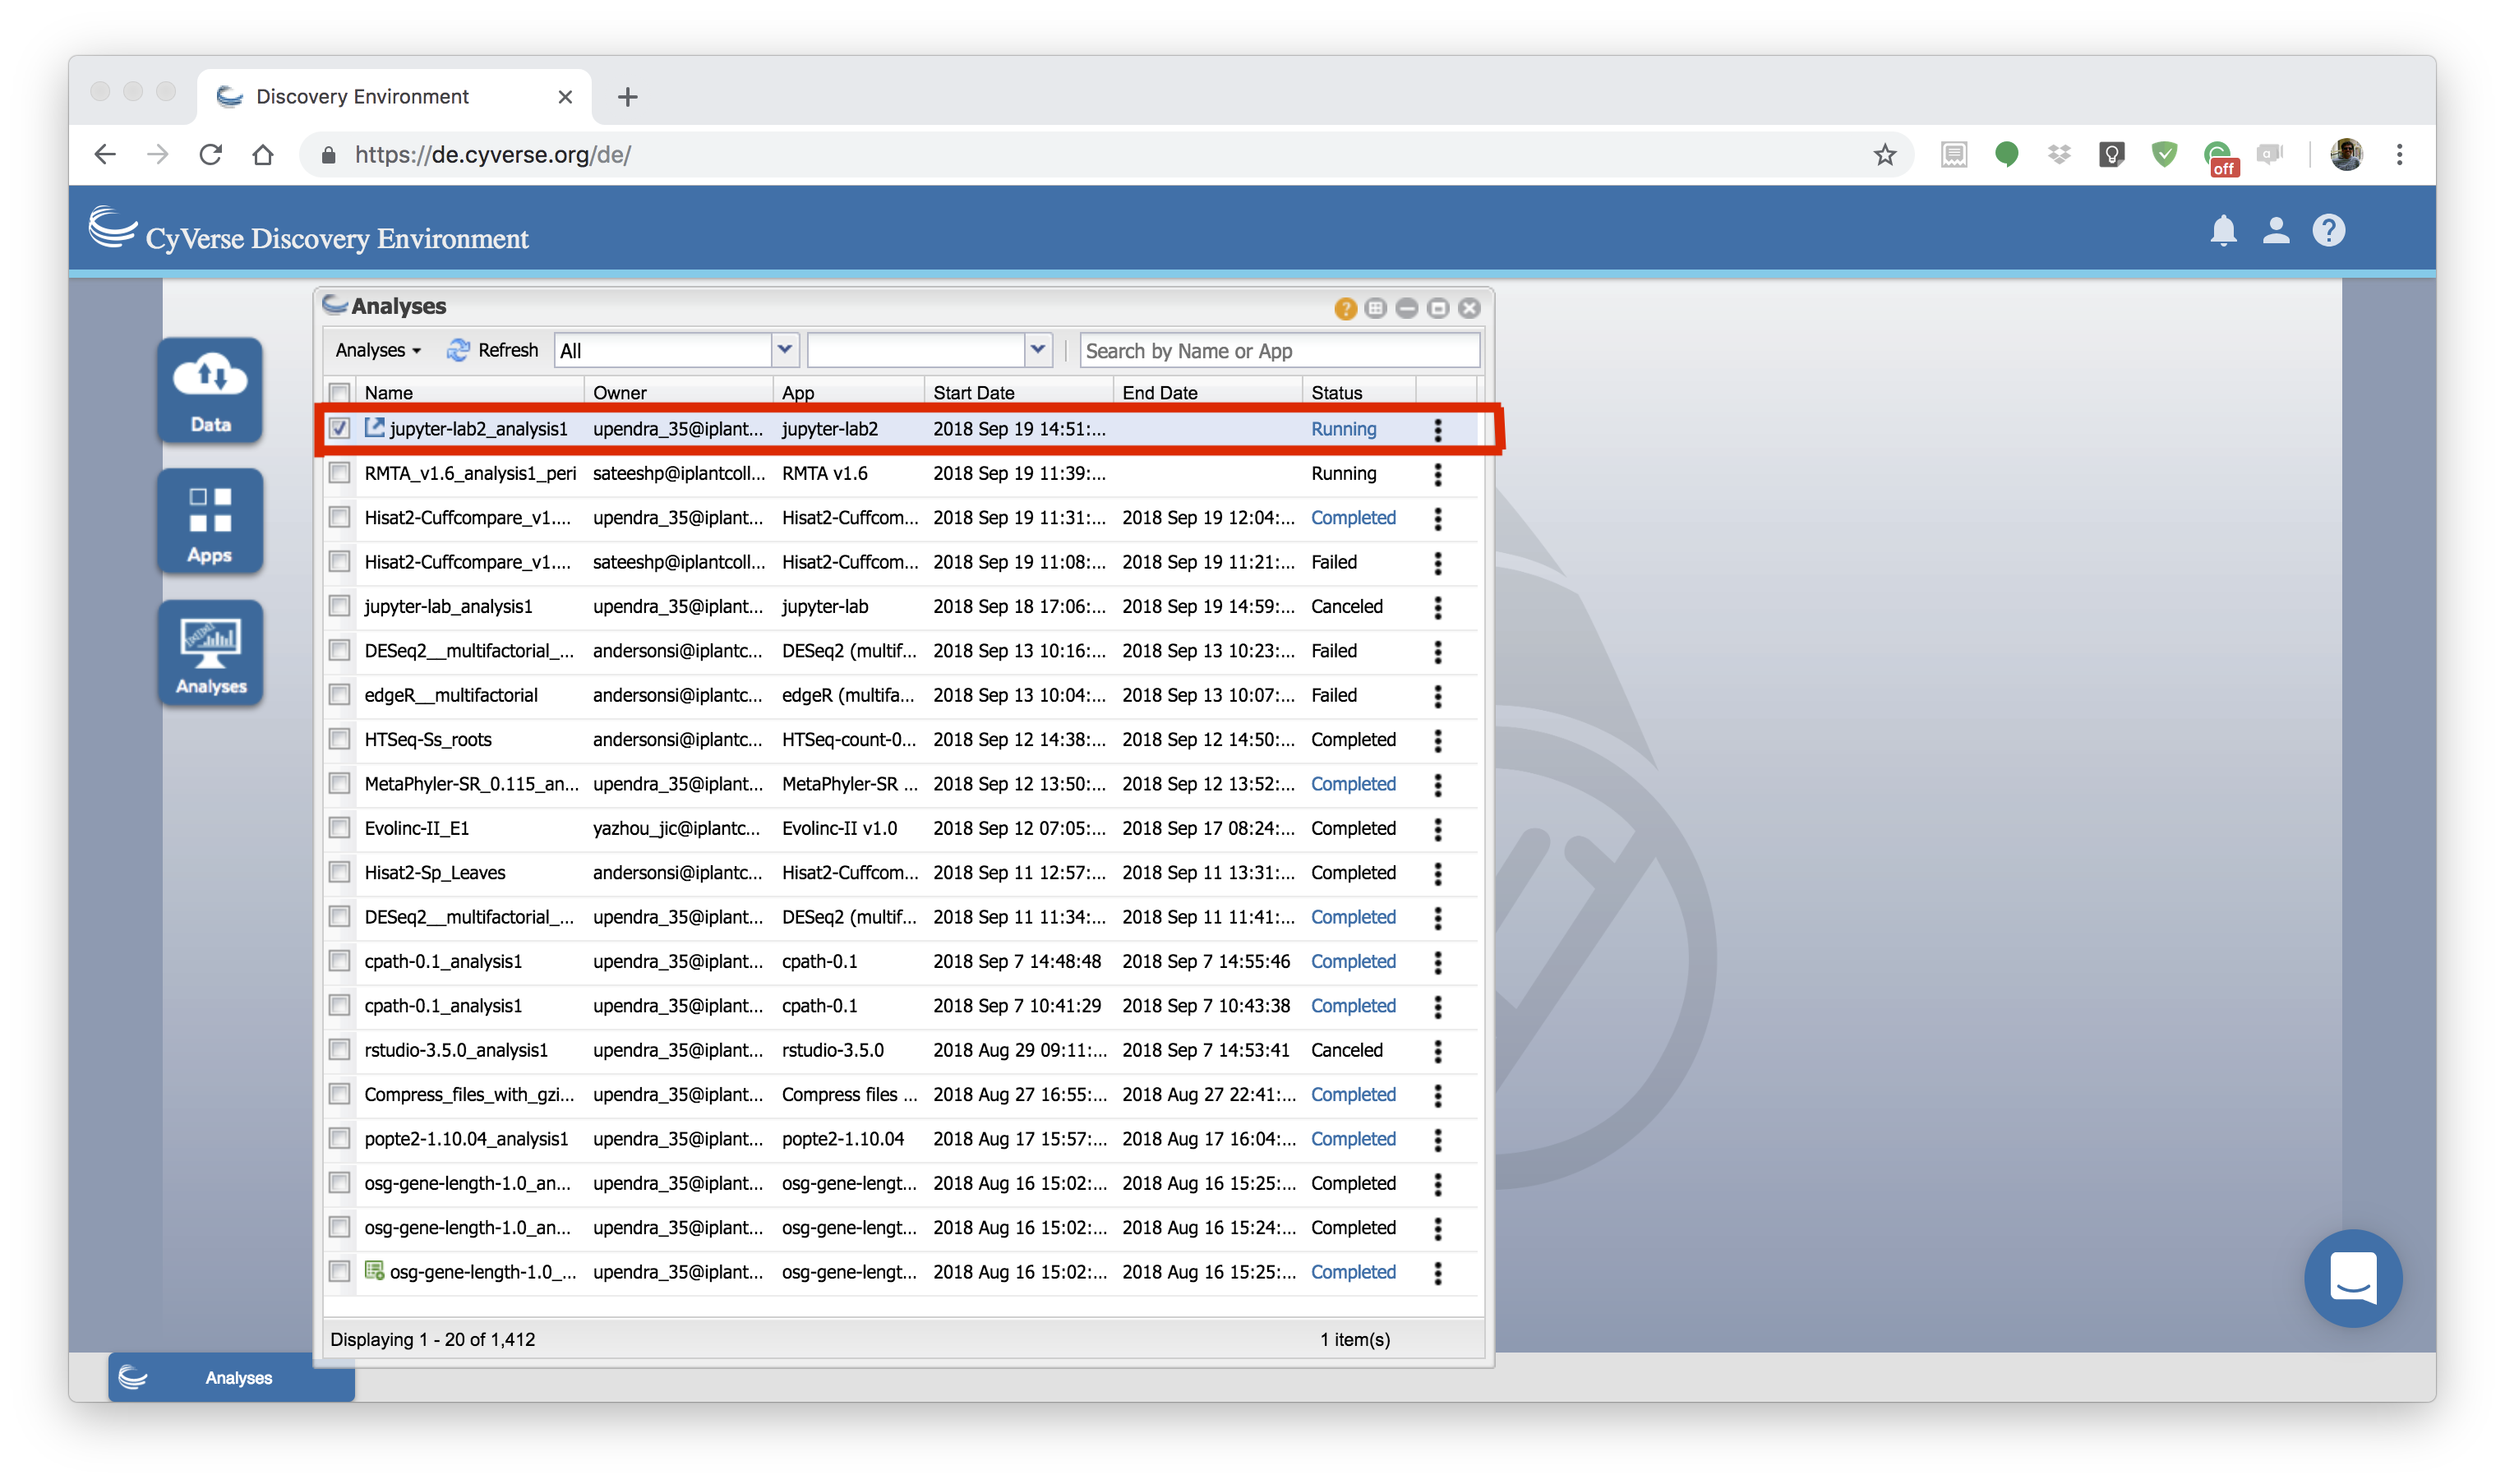
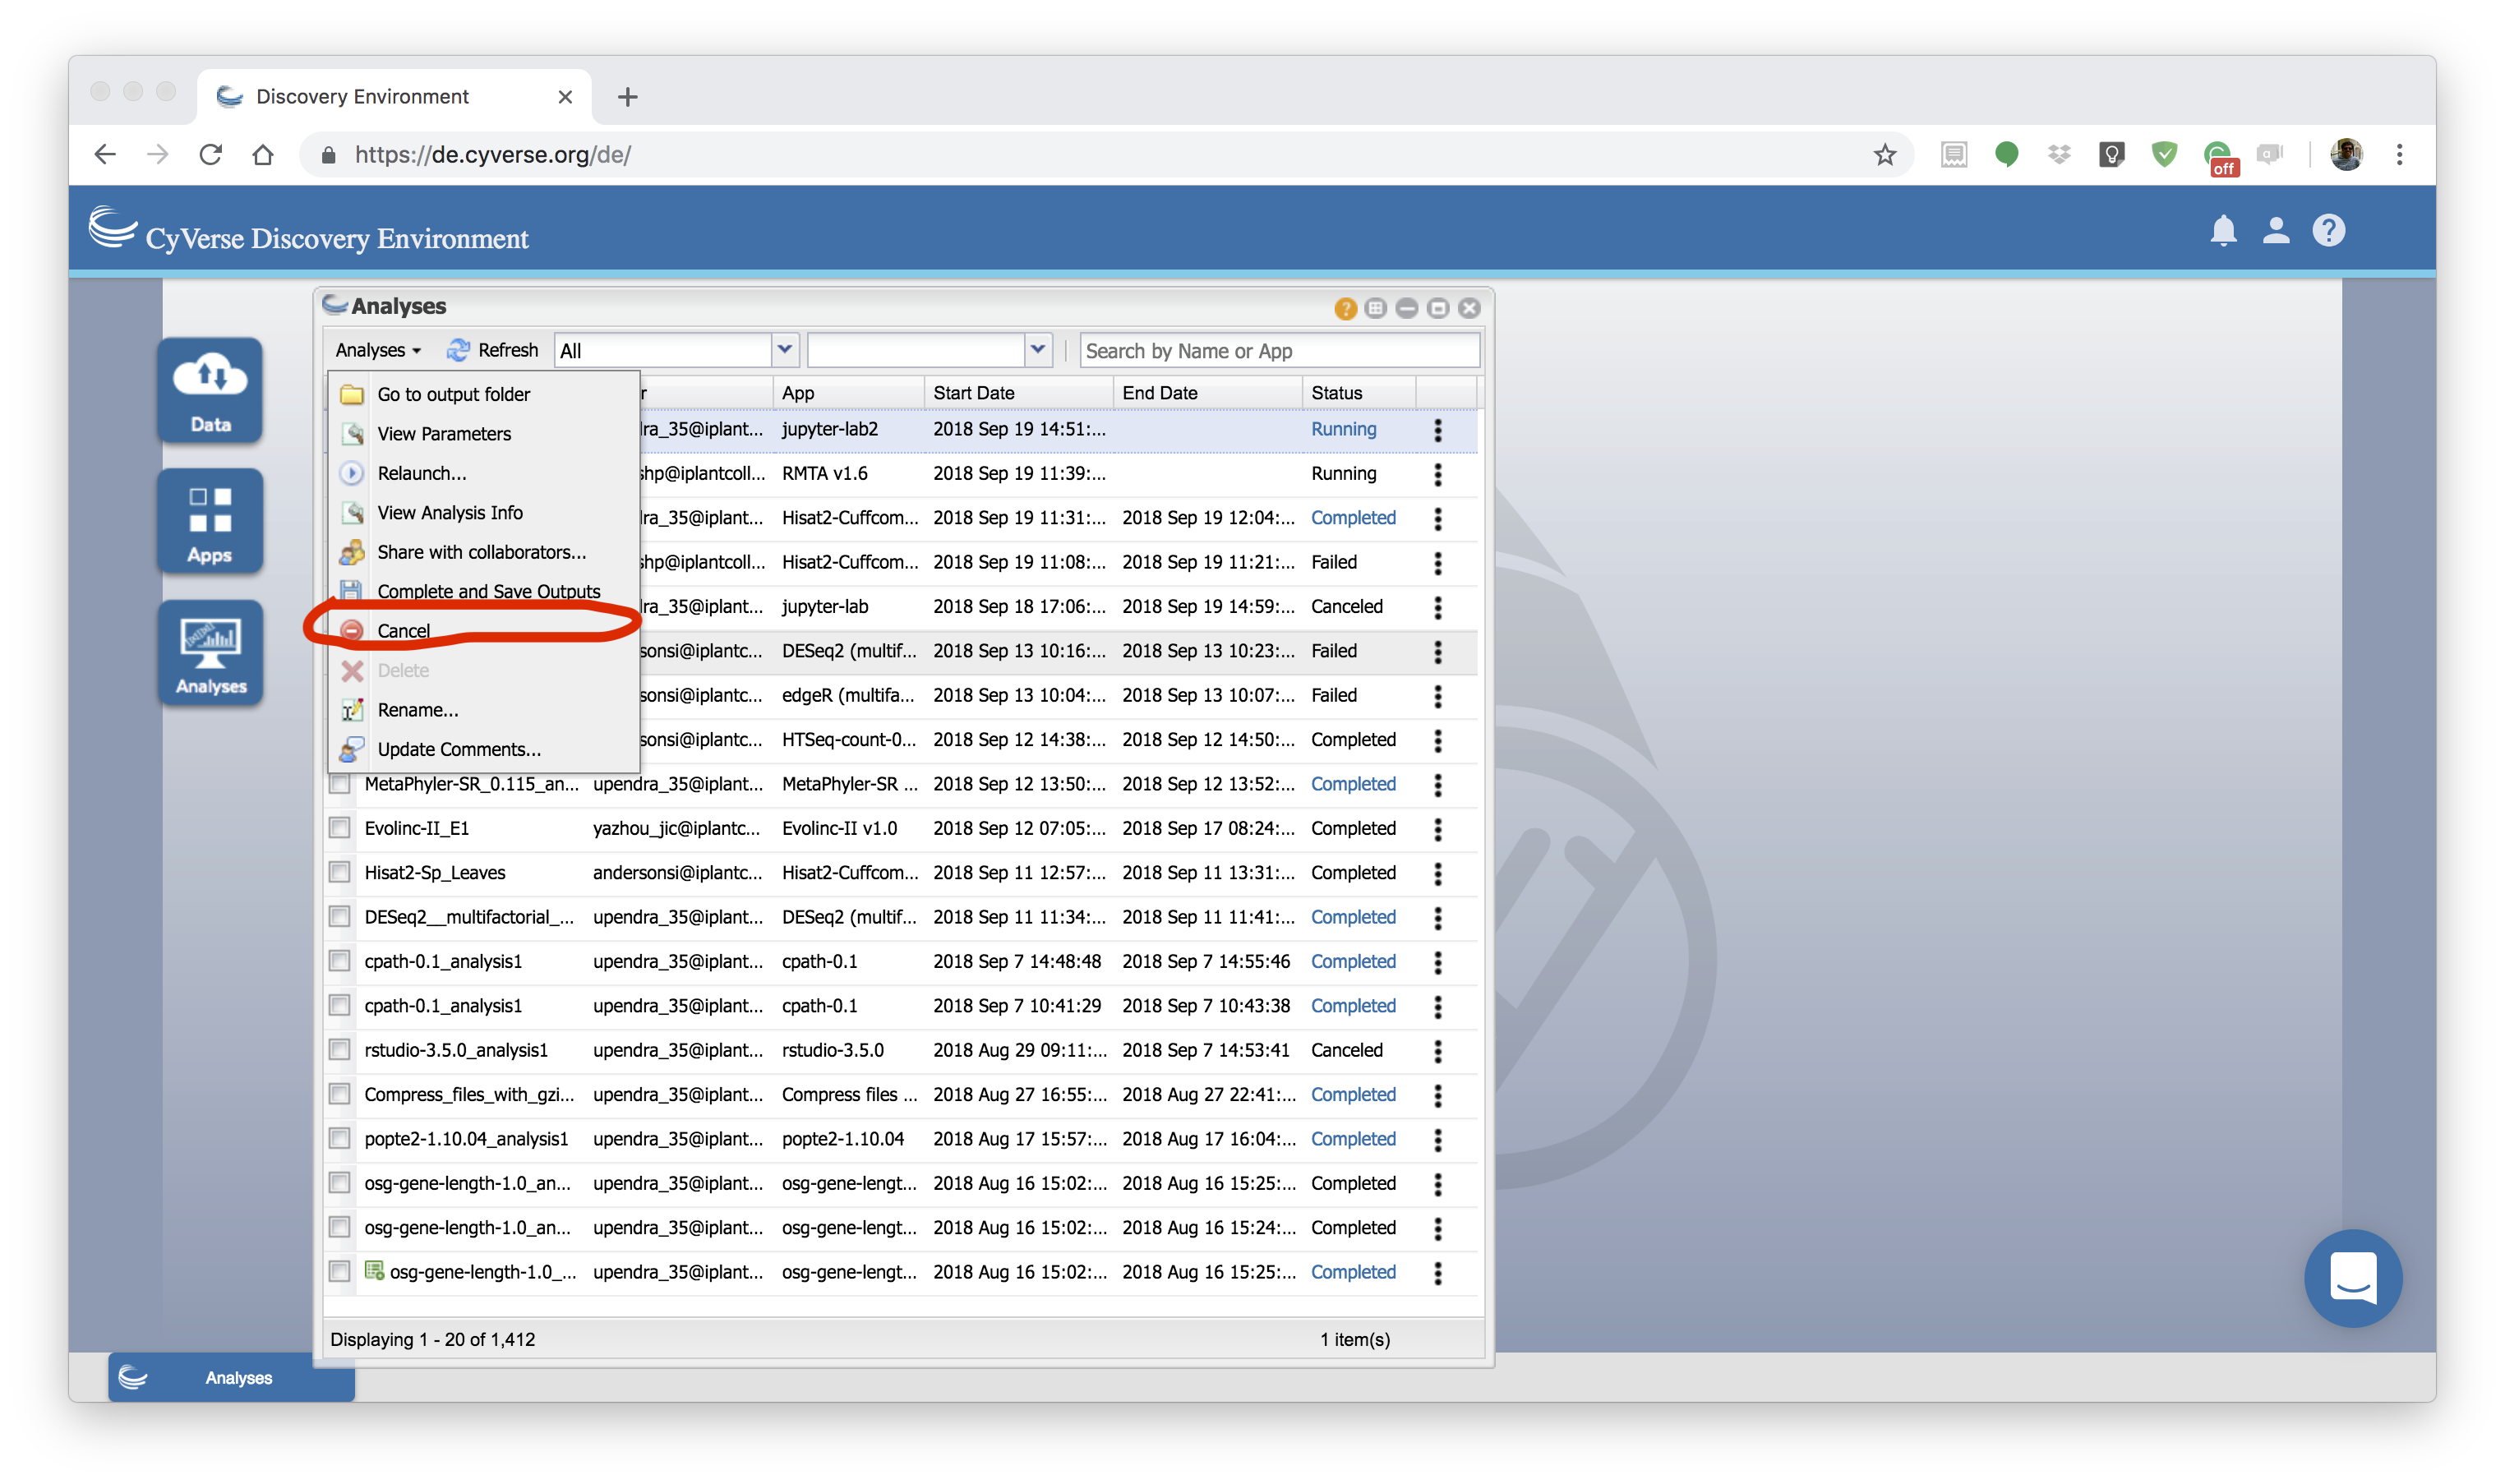
6. Complet and Save Outputs
After finishing your analysis, you can save outputs to data store by clicking the Analysis window, then select the sshiny analysis that you are running and then selecting Complete and Save Outputs under “Analyses” button.
After you had done this, you can find the outputs that you generated (if any) in the analysis of the JupyterLab.
Warning
Currently, VICE can run for 48 hrs beyond which the apps will be terminated. So make sure you run your analysis before 48 hrs.